There is a standard console.log() method as everywhere in Javascript world.
for(var i in Game.creeps) {
    console.log(Game.creeps[i]);
}
Each action command returns code OK if the execution was successful and one of the ERR_* codes in case of error.
var result = creep.attack(target);
if(result != OK) {
    console.log(creep + ' failed to attack the target ' + target +
                    ' with the code: ' + result);
}
Note that a seemingly successful command may not always be executed (for example, your creep faces an obstacle it did not know about when the script started).
In order to safely test your scripts in a parallel copy of the world, you can use our Public Test Realm server.
Debugging in the web version
When playing using the web version of the game, all the console output is being forwarded to the browser console. When you are in the Simulation mode and your script is executed in your browser, that allows you to expand the objects, see and traverse their properties, etc.
Also, in Chrome browser you can use debugger JavaScript keyword to put a breakpoint in the Simulation mode which allows you to pause your script execution for debugging:
var result = creep.attack(target);
if(result != OK) {
debugger;
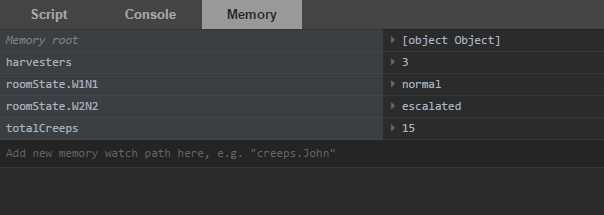
}Memory inspector
If you want to track some values in real-time, write them into Memory and add the corresponding watches in the Memory inspector panel. They will be updated automatically each tick.